 We have developed a set of visualization tools. The currently available tools are PhenoGram, PheWAS-View, and Synthesis-View.
They can be used through the web interface on this site or downloaded as standalone scripts.
We have developed a set of visualization tools. The currently available tools are PhenoGram, PheWAS-View, and Synthesis-View.
They can be used through the web interface on this site or downloaded as standalone scripts.
 With PhenoGram researchers can create chomosomal ideograms annotated with lines in color at specific base-pair locations, or colored base-pair
to base-pair regions, with or without other annotation. PhenoGram allows for annotation of chromosomal locations and/or regions with shapes
in different colors, gene identifiers, or other text. PhenoGram also allows for creation of plots showing expanded chromosomal locations, providing
a way to show results for specific chromosomal regions in greater detail. We have now used PhenoGram to produce a variety of different plots.
These plots include visualization of the genomic coverage of SNPs from a genotyping array, highlighting the chromosomal coverage of imputed SNPs,
copy-number variation region coverage, as well as plots similar to the NHGRI GWA Catalog of genome-wide association results. We are now adding in
the ability to plot data across chromosomes for model organisms.
With PhenoGram researchers can create chomosomal ideograms annotated with lines in color at specific base-pair locations, or colored base-pair
to base-pair regions, with or without other annotation. PhenoGram allows for annotation of chromosomal locations and/or regions with shapes
in different colors, gene identifiers, or other text. PhenoGram also allows for creation of plots showing expanded chromosomal locations, providing
a way to show results for specific chromosomal regions in greater detail. We have now used PhenoGram to produce a variety of different plots.
These plots include visualization of the genomic coverage of SNPs from a genotyping array, highlighting the chromosomal coverage of imputed SNPs,
copy-number variation region coverage, as well as plots similar to the NHGRI GWA Catalog of genome-wide association results. We are now adding in
the ability to plot data across chromosomes for model organisms.
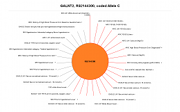
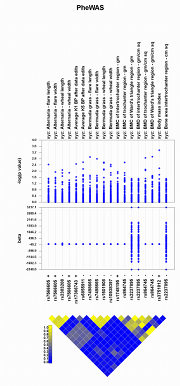
The exploration of data for phenome-wide association studies (PheWAS) presents several challenges, including the need for data visualization to
assist with interpretation of the data. Genome-Wide Association Studies (GWAS) of a single or limited number of traits lend themselves to Manhattan
plots where p-values for every test of association are plotted by chromosomal location (x-axis) and the level of significance is visualized easily (y-axis).
Such a plot does not present the complex relationships that exist between both genotypes and phenotypes in PheWAS. Therefore, to visualize the complex
results of PheWAS, we have developed PheWAS-View, software that can be used to create visual summaries of the SNP, gene, phenotype, and association
information resulting from these studies. Using specialized tools such as PheWAS-View to investigate results on a larger summary level as well as the
individual result level is key for interpretation, analysis, and sharing of PheWAS results. While this tool was developed specifically for PheWAS, it
could be used in other high throughput bioinformatics data where thousands of association results are being explored.
Using Synthesis-View, through the use of stacked data-tracks, information on SNP genomic locations, presence of the SNP in a specific study or analysis, as well as related information such as genetic effect size and summary phenotype information, is plotted according to user preference. Through these data visualizations, rapid comparisons of multiple forms of information are possible, not easily achievable through reviewing results in tabular form alone.