PheWAS-View examples
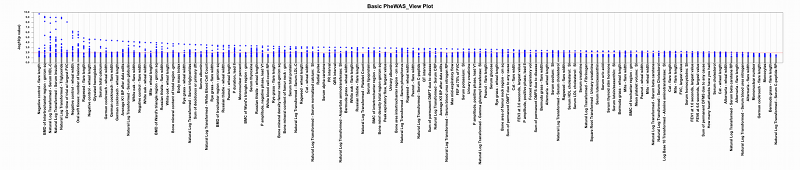
PheWAS-View created the image below using the PheWAS-View sample file provided. The settings used:
- Input file: phewas-view-input.txt
- Title: Basic PheWAS-View Plot
- Red line p value: 0.01
- P value highlight threshold: 0.1
- Format: PNG
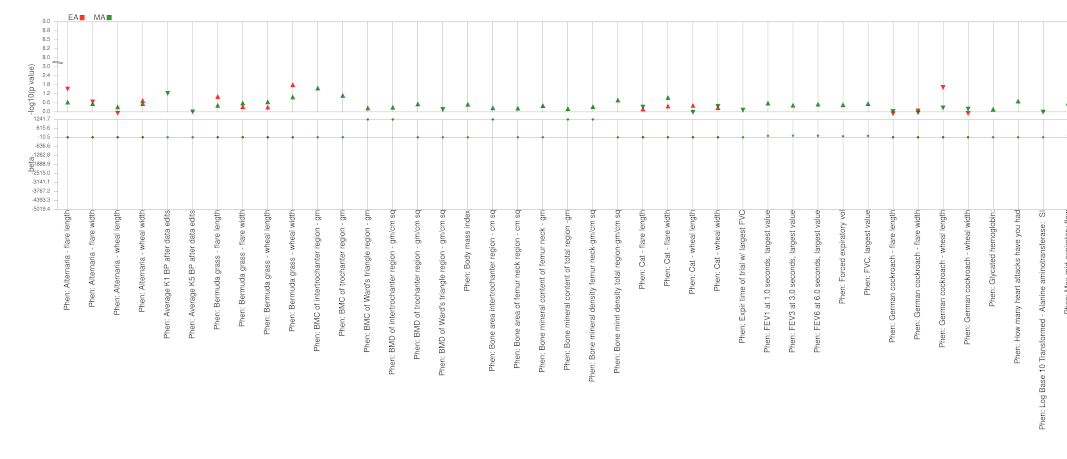
PheWAS-View created the image below using the PheWAS-View extended sample file to produce a plot that displays the p values and direction of effect for a single SNP and multiple groups across different phenotypes. The settings used:
- Input file: phewas-view-in-extended.txt
- Group file: phewas-view-group.txt
- Title: Single SNP results with multiple groups
- SNP Name: rs12678919
- Red line p value: 0.001
- Format: PNG
- Colors by group?: Checked
- Show direction of effect?: Checked
- Direction of effect?: Checked
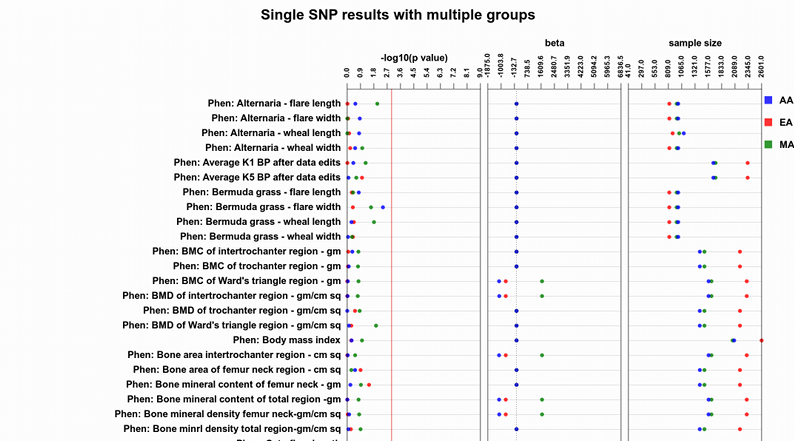
PheWAS-View created the image below using the PheWAS-View extended sample file to produce a plot that displays the p values and direction of effect for a single SNP and multiple groups across different phenotypes. The settings used:
- Input file: phewas-view-in-extended.txt
- Group file: phewas-view-group.txt
- Title: Single SNP results with multiple groups
- Red line p value: 0.001
- P value highlight threshold: 0.001
- Format: PNG
- Direction of effect?: Checked
- Rotated?: Checked
- Sample size track?: Checked
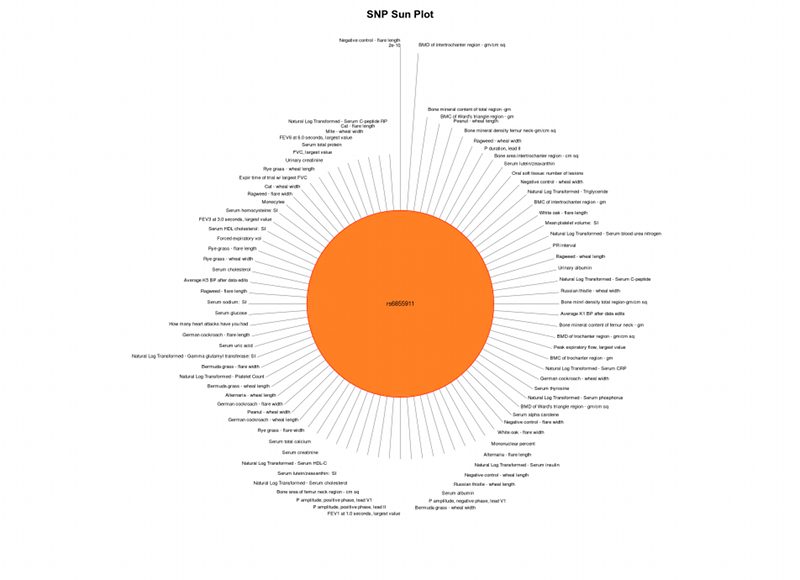
PheWAS-View Sun examples
PheWAS-View created the image below using the PheWAS-View sample file provided. The settings used:
- Input file: phewas-view-input.txt
- Title: SNP Sun Plot
- P value threshold: 0.4
- SNP Name: rs6855911
- Format: PNG